Tag: binder
Creating a Shareable Bokeh Dashboard with Binder
Recently, I finished a personal project in which I analyzed the results of the “Who is your favorite Pokemon” survey. After that, I wanted to generate a more interactive visualization in which the user could choose a specific Pokemon and see its results. After pondering different options, I decided to do so in Bokeh because of a few reasons. First of all, you can generate your visualizations using Python only. Furthermore, it is very easy to incorporate Bokeh in Jupyter notebooks, which is great to generate a first version of the prototype. Lastly, a few colleagues of mine have used it for their projects at work and have been very happy with it.
Who is Your Favorite Pokémon? (Interactive)
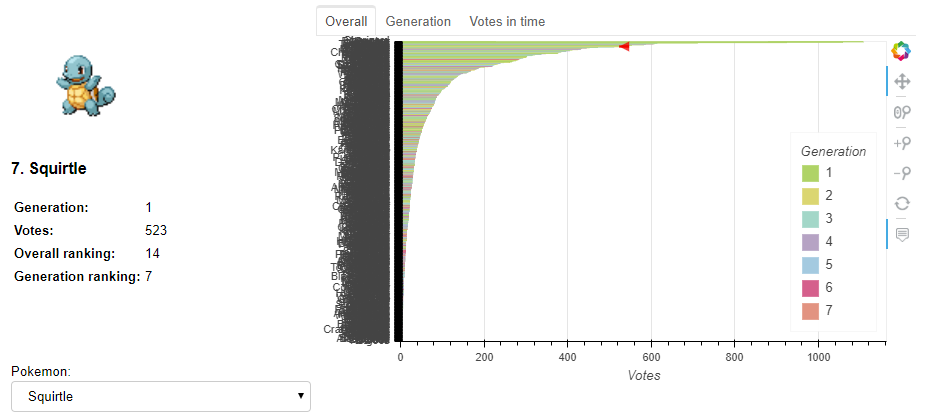
Previously, I looked into Pokémon’s popularity from all 7 generations. However, I felt the visualizations were a bit static. Furthermore, you couldn’t get details on your preferred Pokémon. Therefore, I decided to extend this project and created an interactive dashboard using Bokeh and Binder to visualize the results of the survey. It allows you to choose whatever Pokémon you want and see its preference ranking compared to all Pokémon, compared to all Pokéon of its generation, and how did people voted for it in time during the period in which the survey was open (notice how the color of that plot corresponds to the Pokémon’s dominant color)